
Materials: Y Balance Test Kit.
Methods:
- To measure upper limb length, the patient stands in an anatomical position while the investigator identified the C7 vertebrae. After C7 was identified, the investigator instructs the subject to raise (abduct) the right limb to shoulder height (90°). The examiner then measures the distance from the C7 spinous process to the most distal tip of the right middle finger (in centimeters) with a tape measure.
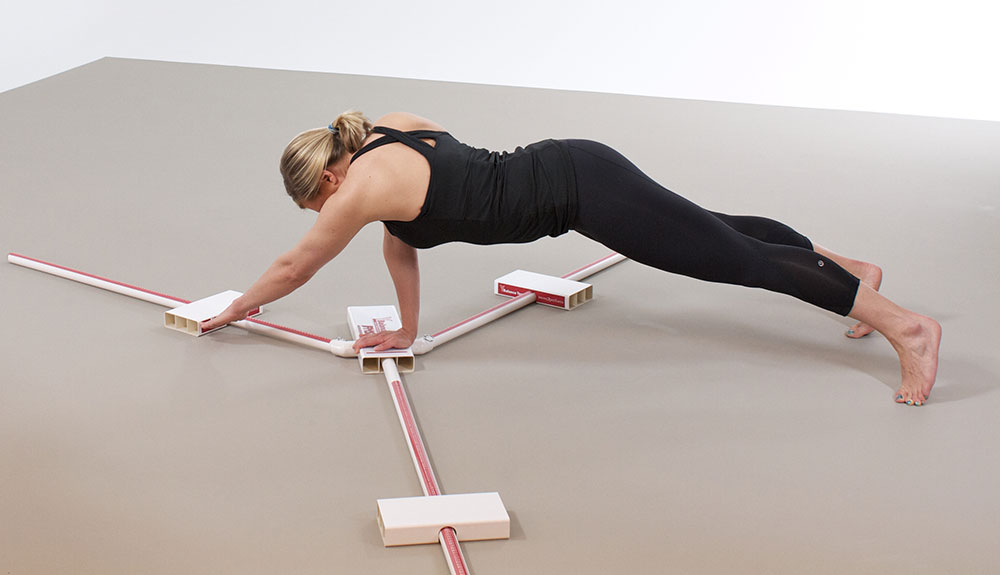
- To perform the YBT-UQ, the subject assumes the starting position with testing hand on the stance platform and the thumb adducted while being aligned behind the red starting line.
- The starting position for the reach hand was defined by positioning the reach hand on top of the medial reach indicator placed shoulder width from the stance plate.
- Performance on the test consisted of the subject reaching in the 3 reach directions (Medial, Superolateral, Inferolateral) with the free hand while maintaining a push-up position with feet shoulder width apart.
- The trial was discarded and repeated if: The subject failed to maintain unilateral stance on the platform (e.g., touched down to the floor with the reach hand or fell off the stance platform), failed to maintain reach hand contact with the reach indicator on the target area while it was in motion (e.g., shoved the reach indicator), used the reach indicator for stance support (e.g., placed fingers or hand on top of the reach indicator), failed to return the reach hand to the starting position under control, or lifted either foot off of the floor.
- This process is repeated until 3 trials in each direction on each hand are performed.
- The maximum reach distances are divided by the subject’s upper limb length to normalize each reach distance.
- The composite reach distance was calculated by averaging the greatest trial in each of the 3 normalized reach distances for an analysis of overall performance on the test.
Reliability:
| Study | Population | Type | ICC |
| Gorman et al., 2012 | Active Adults (19–47 years old) | Test-retest Reliability | 0.80-0.99 |
| Active Adults (19–47 years old) | Inter-rater Reliability | 1.00 | |
| Westrick et al., 2012 | Young Adults (Average age = 19.5, 18.8) | Test-retest Reliability | 0.91, 0.92 |
Normative Data:
| Study | Population | Study Design | Reference Value |
| Gorman et al., 2012 | Young Males (19–47 years old) | Descriptive Laboratory Study | Percent of Limb Length: Med = 97.2%, SL= 70.9%, IL= 84.2%, Composite = 85.1% |
| Young Females (19–47 years old) | Percent of Limb Length: Med = 95.2%, SL= 70.4%, IL= 82.7%, Composite = 83.9% | ||
| Westrick et al., 2012 | Active Males (19–47 years old) | Descriptive Laboratory Study | Percent of Limb Length: Med = 97.2%, SL= 70.9%, IL= 84.2%, Composite = 85.1% |
| Active Females (19–47 years old) | Percent of Limb Length: Med = 95.2%, SL= 70.4%, IL= 82.7%, Composite = 83.9% | ||
| Young Adults (Average age = 19.5, 18.8) | Dominant: Med =86.0 , SL= 58.2, IL = 82.5 cm, Composite = 85.7% | ||
| Young Adults (Average age = 19.5, 18.8) | Non-Dominant: Med = 86.5, SL= 61.2, IL = 83.5 cm, Composite = 87.6% | ||
| Young Males (Average age = 19.5) | Dominant: Composite = 86.5%, Non-Dominant: Composite = 88.1% | ||
| Young Females (Average age = 18.8) | Non-Dominant: Composite = 82.9%, Non-Dominant: Composite = 85.2% | ||
| Butler et al., 2014 | Male Collegiate Swimmers (Average Age = 19.3) | Descriptive Laboratory Study | Percent of Limb Length: Med = 100%, SL= 74.9%, IL= 89.8%, Composite = 88.3% |
| Female Collegiate Swimmers (Average Age = 19.1) | Percent of Limb Length: Med = 92.5%, SL= 72.1%, IL= 85.6%, Composite = 83.4% | ||
| Butler et al., 2014 | Collegiate Baseball & Softball Players (Average Age= 15.8-15.2) | Descriptive Laboratory Study | Throwing Arm: Med = 99.1%, SL= 70.4%, IL = 90.3%, Composite = 86.6% |
| Non-Throwing Arm: Med = 98.4%, SL= 70.6%, IL = 90.8%, Composite = 87.2% | |||
| Teyhen et al., 2014 | Military Personnel (Average age= 28.7) | Descriptive Laboratory Study | Composite= 87.6% |
| Male Military Personnel (Average age= 29.0) | Composite= 89.5% | ||
| Female Military Personnel (Average age= 28.3) | Composite= 84.9% | ||
| Military Personnel (Under 30 years old) | Composite= 88.2% | ||
| Military Personnel (Over 30 years old) | Composite= 86.6% | ||
| Taylor et al., 2015 | Female Collegiate Athletes (Average age =19.2) | Descriptive Laboratory Study | Dominant: Composite = 91.7%, Non-Dominant: Composite = 92.1% |
| Male Collegiate Athletes (Average age =19.3) | Dominant: Composite = 101.4%, Non-Dominant: Composite = 101.8% | ||
| Myers et al., 2016 | Male High School Wrestlers | Descriptive Laboratory Study | Right: Med = 106.9%, SL= 73.9%, IL = 93.9%, Composite = 91.6% |
| Left: Med = 107.6%, SL= 71.9%, IL = 96.9%, Composite = 92.1% | |||
| Male High School Baseball Players | Right: Med = 97.0%, SL= 73.1%, IL = 85.3%, Composite = 84.5% | ||
| Left: Med = 97.1%, SL= 70.9%, IL = 85.6%, Composite = 85.1% | |||
| Borms et al., 2016 | Overhead Athletes (Average age= 21.6) | Descriptive Laboratory Study | Dominant: Med = 101.2%, SL= 73.1%, IL = 96.1%, Composite = 90.1% |
| Non-Dominant: Med = 101.1%, SL= 71.5%, IL = 96.4%, Composite = 89.7% | |||
| Teyhen et al., 2016 | Military Personnel with 0 Health Risk Factors (Average age= 24.7) | Cross-Sectional | Composite= 89.9% |
| Military Population with 1 Health Risk Factor (Average age= 24.7) | Composite= 88.4% | ||
| Military Population with 2 Health Risk Factors (Average age= 24.7) | Composite= 86.7% | ||
| Military Population with 3-4 Health Risk Factors (Average age= 24.7) | Composite= 85.3% | ||
| Salo et al., 2017 | Fatigued Recreational Weight Lifters (Average age= 25.5-26) | Randomized Controlled Trial | Pre-Test: Med= 100.7/100.6%, SL= 65.6/67.2%, IL= 95.6/87.5%, Composite= 87.3/86.7% |
| Post-Test: Med= 96.1/98.5%, SL= 55.5/55.0%, IL= 87.6/80.0%, Composite= 79.7/77.8% | |||
| Non-Fatigued Recreational Weight Lifters (Average age= 25.5-26) | Pre-Test: Med= 97.1%/99.8%, SL= 68.3/69.6%, IL= 92.4%/85.8, Composite= 85.9/85.1% | ||
| Post-Test: Med= 98.1/101.5%, SL= 68.4/70.9%, IL= 94.7/87.1% , Composite= 87.1/86.5% |
Research:
1. Gorman P, et al. Upper Quarter Y Balance Test: Reliability and Performance Comparison Between Genders in Active Adults. Journal of Strength and Conditioning Research. 2012; 26(11): 3043–3048.
2. Westerick R, et al. Exploration of the Y-Balance Test for Assessment of Upper Quarter Closed Kinetic Chain Performance. International Journal of Sports Physical Therapy. 2012; 7(2): 139–147.
3. Butler R, Arms J, Reiman M, et al. Sex Differences in Dynamic Closed Kinetic Chain Upper Quarter Function in Collegiate Swimmers. Journal of Athletic Training. 2014;49(3). doi:10.4085/1062-6050-49.3.17.
4. Butler RJ, Myers HS, Black D, et al. BILATERAL DIFFERENCES IN THE UPPER QUARTER FUNCTION OF HIGH SCHOOL AGED BASEBALL AND SOFTBALL PLAYERS. International Journal of Sports Physical Therapy. 2014;9(4):518-524.
5. Teyhen DS, Riebel MA, McArthur DR, et al. Normative Data and the Influence of Age and Gender on Power, Balance, Flexibility, and Functional Movement in Healthy Service Members. Military Medicine. 2014;179(4):413-420. doi:10.7205/MILMED-D-13-00362.
6. Taylor JB, Wright AA, Smoliga JM, DePew JT, Hegedus EJ. Upper Extremity Physical Performance Tests in Collegiate Athletes. Journal of Sport Rehabilitation. 2015. [Epub ahead of print]
7. Teyhen DS, Shaffer SW, Butler RJ, et al. What Risk Factors Are Associated With Musculoskeletal Injury in US Army Rangers? A Prospective Prognostic Study. Clinical Orthopaedics and Related Research. 2015;473(9):2948-2958. doi:10.1007/s11999-015-4342-6.
8. Myers H, Poletti M, Butler RJ. Functional Performance on the Upper Quarter Y-Balance Test Differs Between High School Wrestlers and Baseball Players. Journal of Sport Rehabilitation. August 2016:1-20. doi:10.1123/jsr.2015-0168.
9. Borms D, Maenhout A, Cools AM. Upper Quadrant Field Tests and Isokinetic Upper Limb Strength in Overhead Athletes. Journal of Athletic Training. November 2016. doi:10.4085/1062-6050-51.12.06.
10. Teyhen DS, Rhon DI, Butler RJ, et al. Association of Physical Inactivity, Weight, Smoking, and Prior Injury on Physical Performance in a Military Setting. Journal of Athletic Training. 2016;51(11):866-875. doi:10.4085/1062-6050-51.6.02.
11. Salo TD, Chaconas E. The Effect of Fatigue on Upper Quarter Y-Balance Test Scores in Recreational Weightlifters: A Randomized Controlled Trial. International Journal of Sports Physical Therapy. 2017;12(2):199-205.
Continued Reading…


![]()
